OLAP client (OnLine Analytical Processing
These are data structures designed to quickly view data stored in an OLAP database.
A database (warehouse) is best thought of as one of the Excel spreadsheets. So we have 2 dimensions: columns and rows. Because of this way of storing, these databases are also called relational databases.
The principle of the cube itself is very similar to that of pivot tables in Excel, allowing the user to produce even more complex reports using only the mouse.
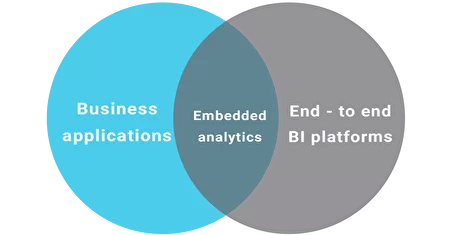
Embedded analytics
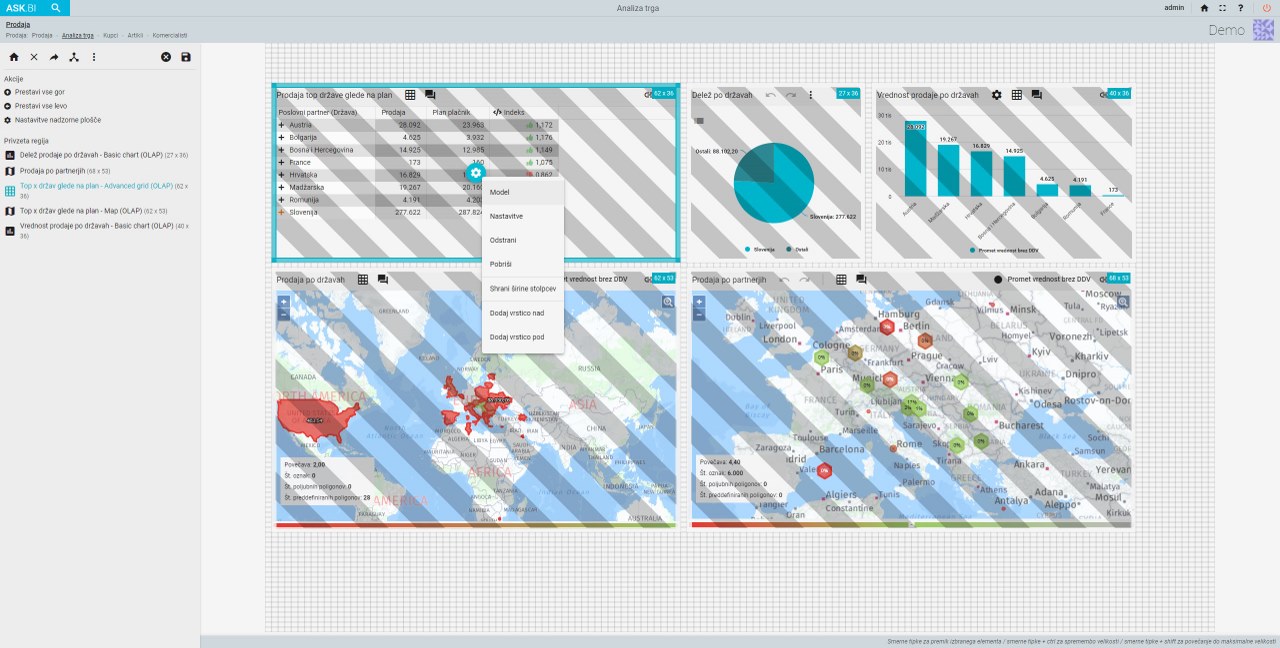
The ASK.BI platform is a powerful environment where we bring data from different sources: OLAP, SQL queries, APIs, IoT. The solution can be used as an enterprise analytics platform, but it can also be used as an analytics solution for another system. All dashboards can be embedded in another system, which is very important when we want users to use only one solution.
Example: a company is developing an MES system that reads data from machines and devices. The data is stored in a database and ASK.BI displays (visualises) it accordingly. Each company does its own part of the business it handles.


