Alarms - alert system
- monitoring your business in virtually real time;
- alerts you when it is needed – and gives you quick access to details;
- receive it in the form of an email or notification;
- tailored to the user;
- in the case of monitoring data directly from a transactional database (ERP or PIS systems), an alarm alerts to events occurring in any environment in the company;
- an alarm alerts to a change in a trend.
Trends
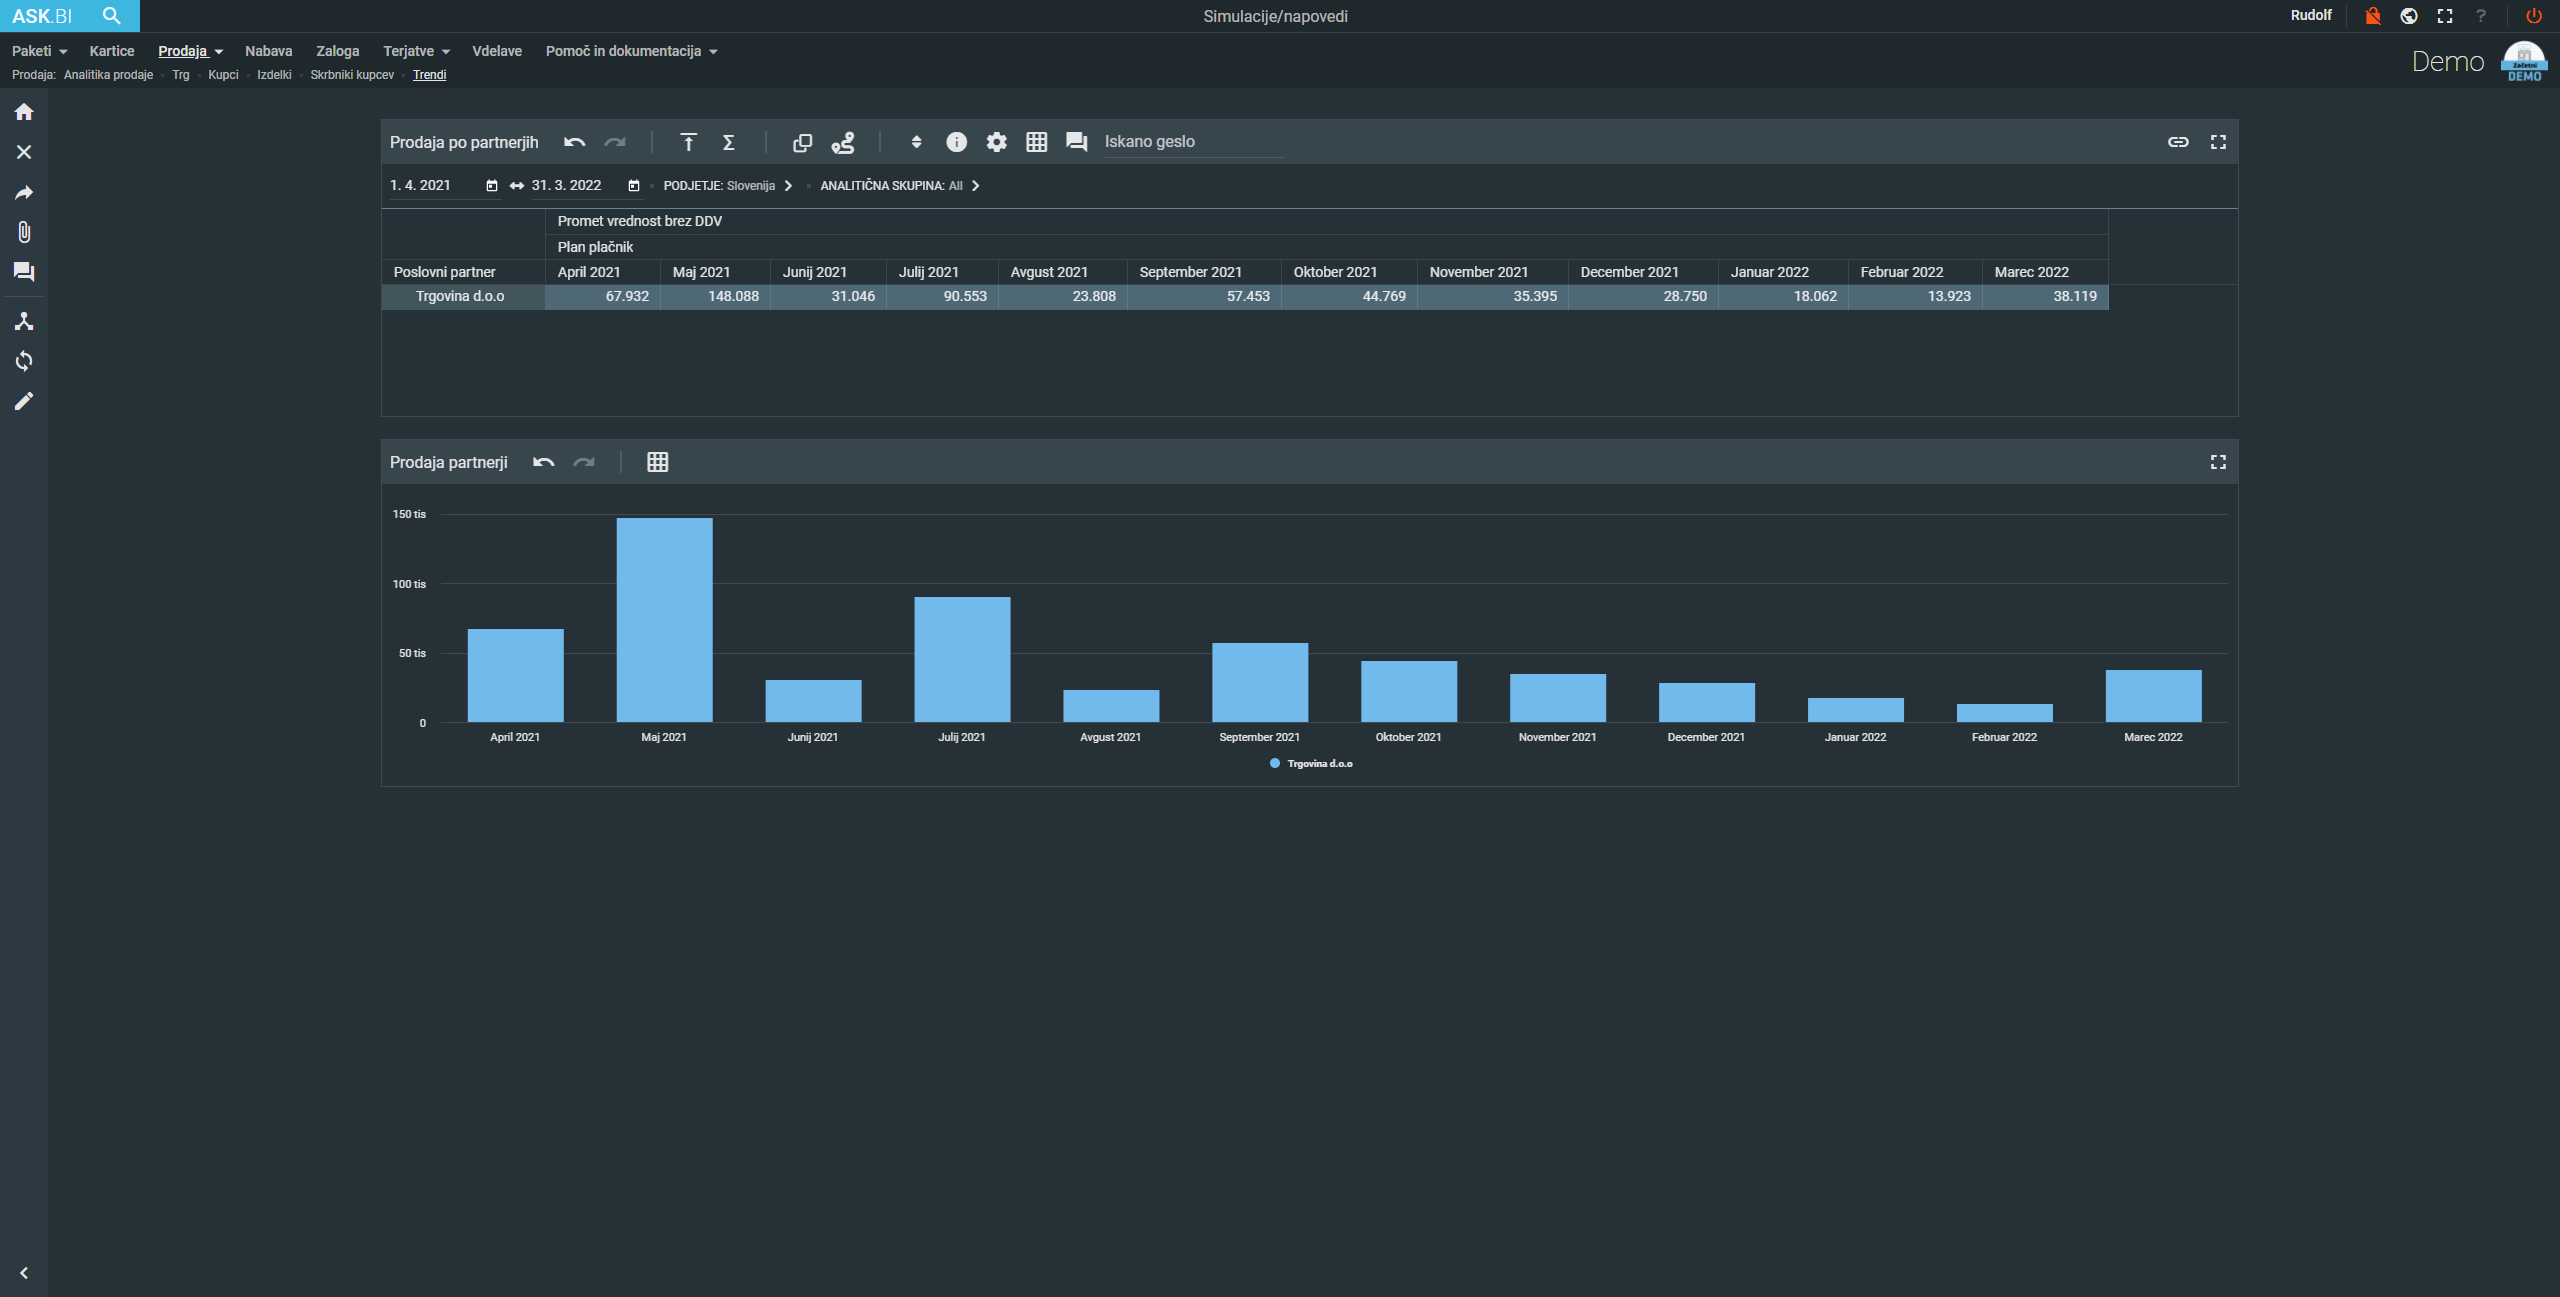
ASK.BI allows you to display trends for any numerical value by day, month or year.
At the click of a button, we get information about what is happening to a particular data over time, which means that we do not need to break the data down by different time periods (years, months, days), but the system does it automatically for us.
We use trends when we want to see data in context with a plan or a historical value.
E-mail reporting
ASK.BI allows you to display trends for any numerical value by day, month or year.
At the click of a button we get information about what is happening to a particular data over time, which means that we don’t need to break the data down by different time periods (years, months, days), but the system does it automatically for us.
We use trends when we want to see data in context with a plan or a historical value.
Forecasts
We use forecasts to get a sense of the direction of the business and to answer the question of where we are going. Direction is more important than the decimal number. We make forecasts based on historical data and experience.
ASK.BI uses a time gate model to forecast sales by: days, weeks, months and years.

Search - search by data
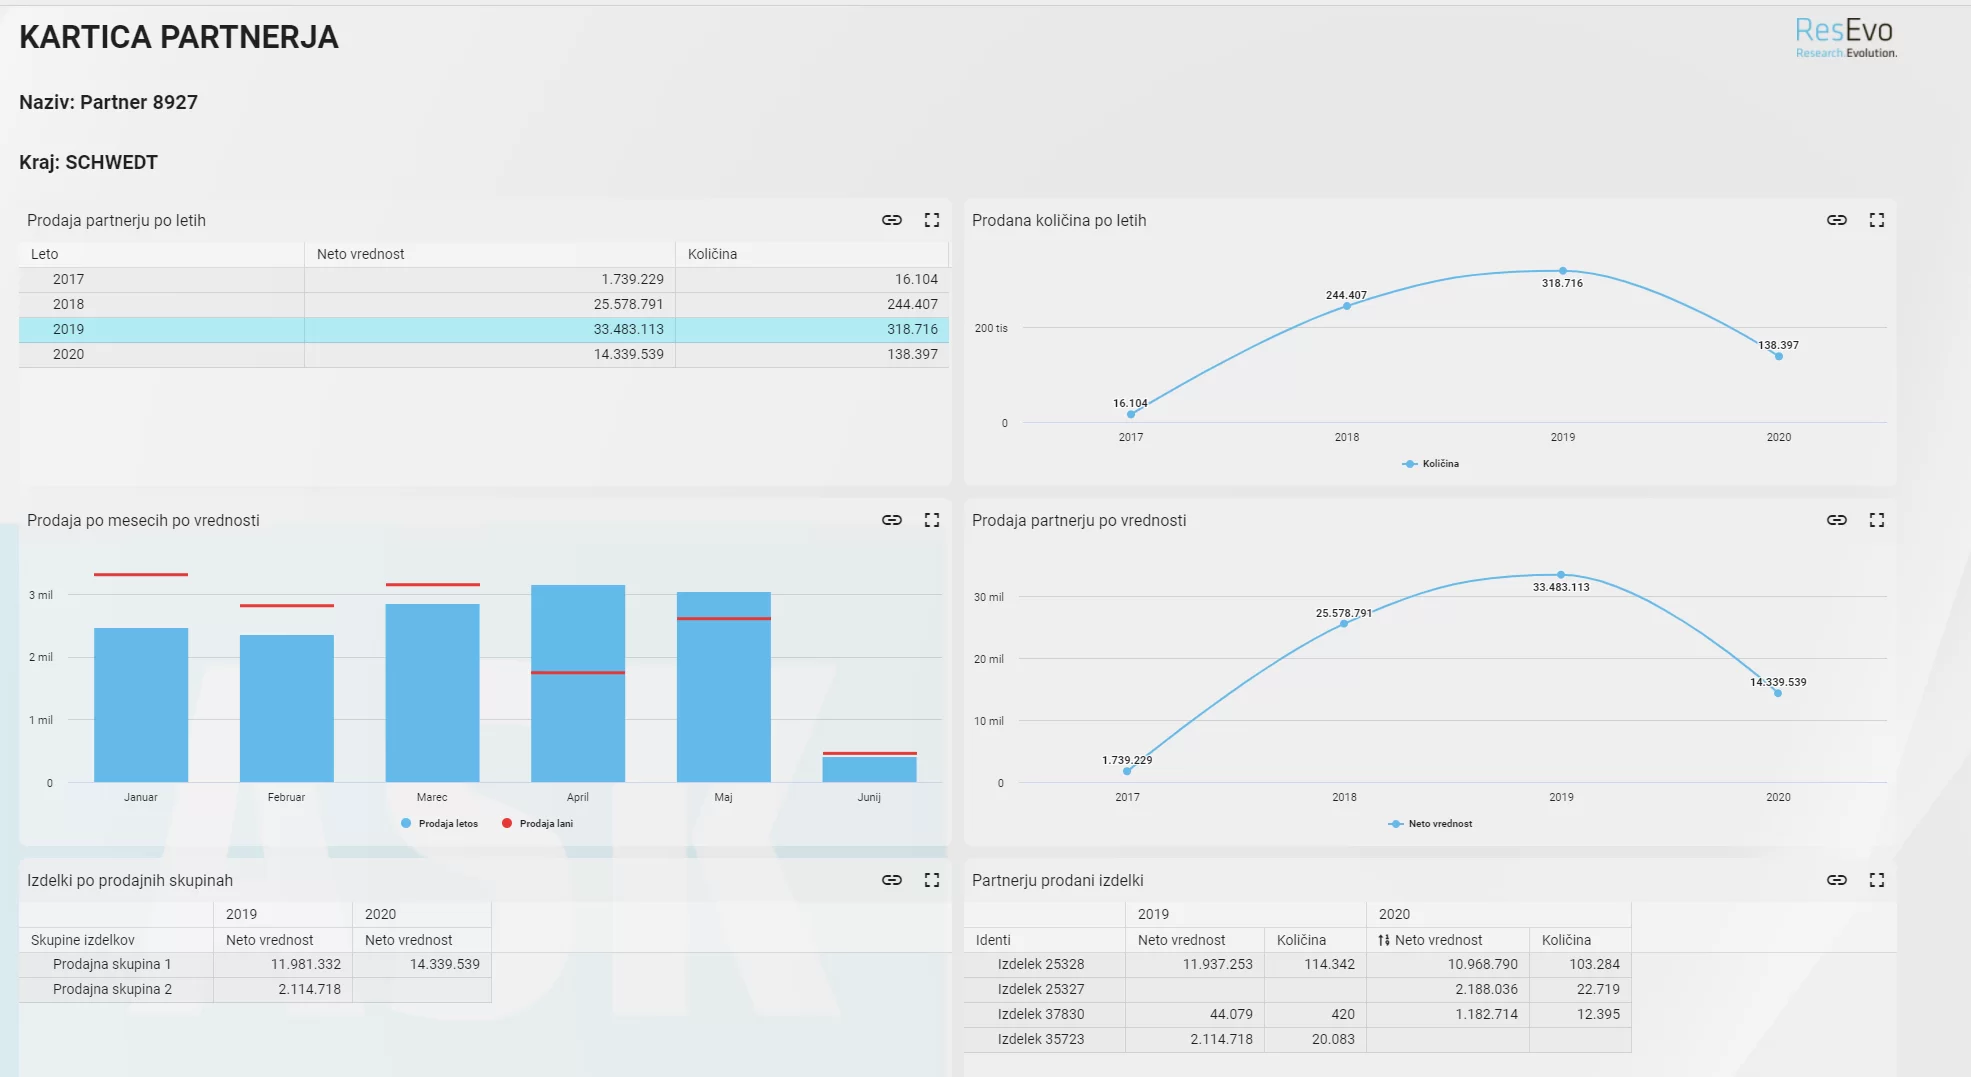
“Google” your company data
Display on TVs / screens
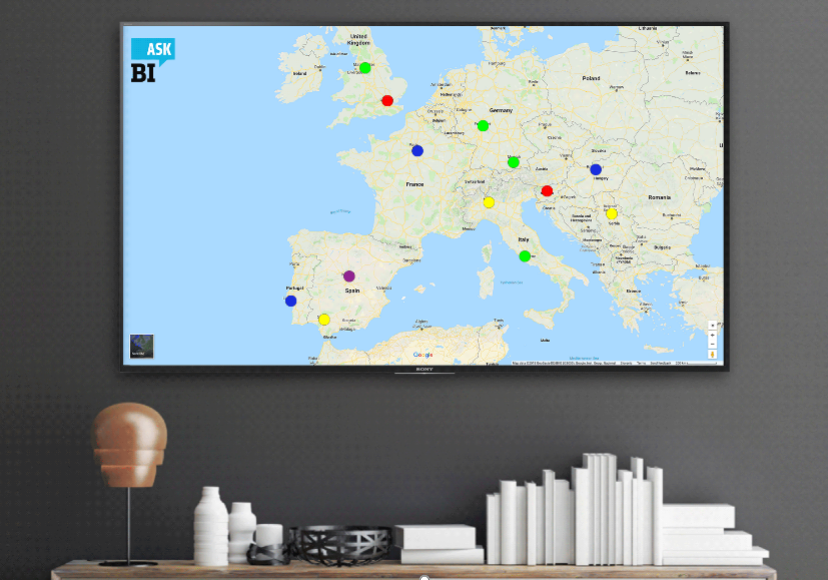
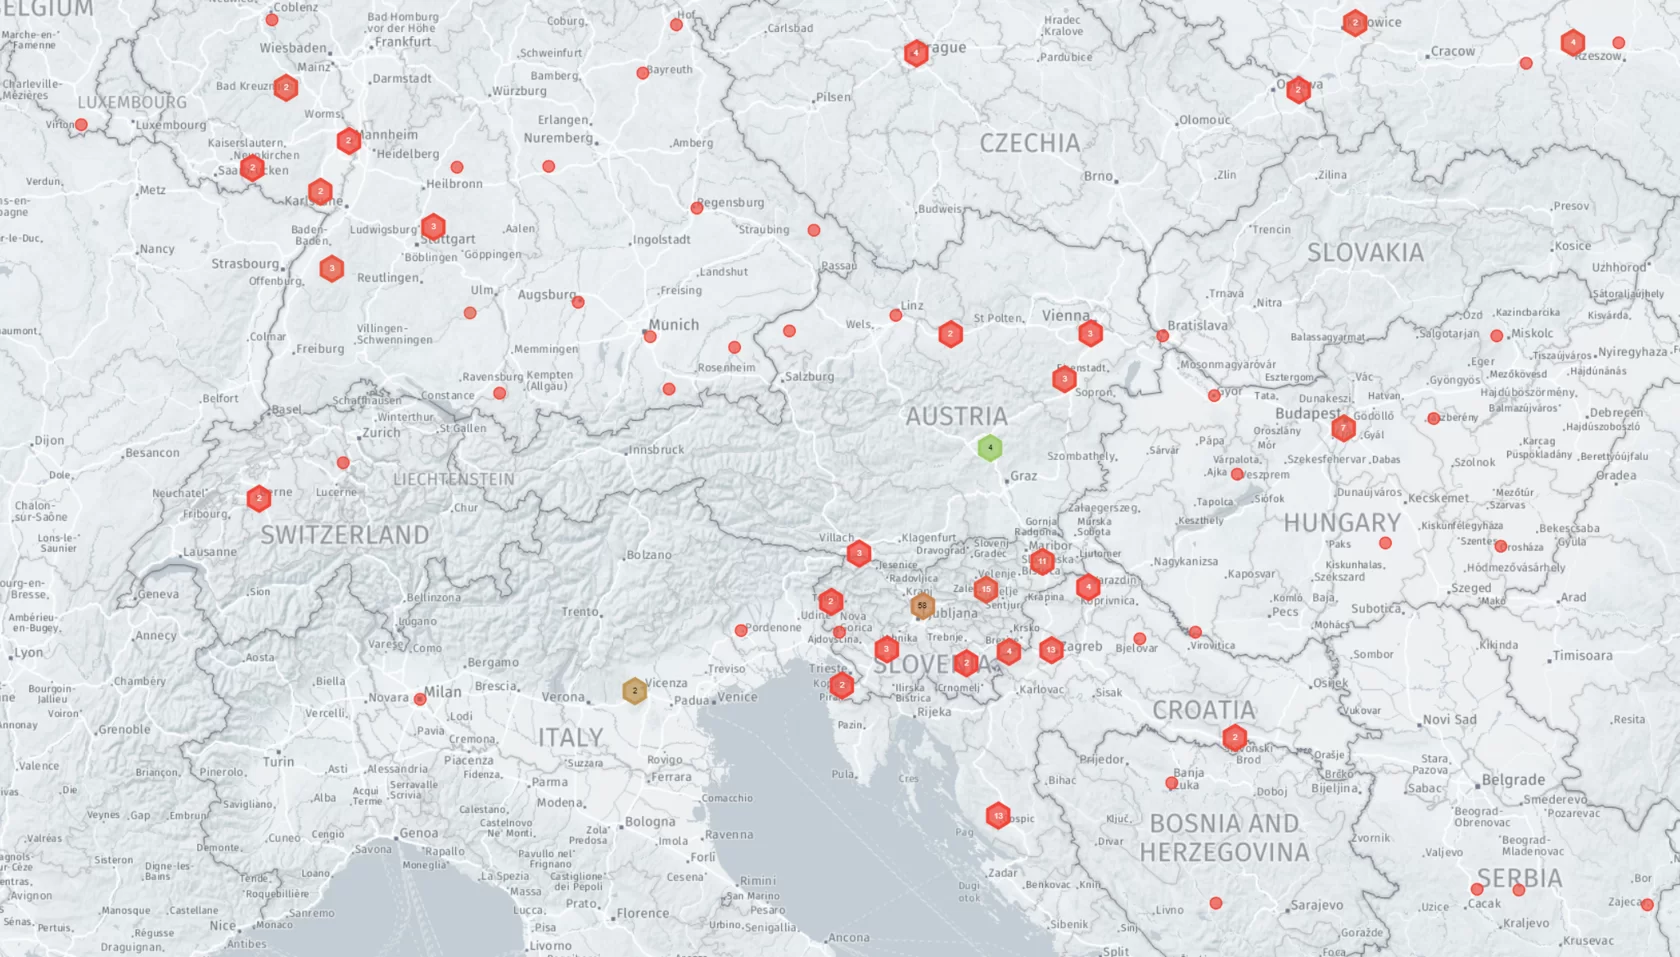
Data visualisation, graphs, reports, maps can be shown on any screen you want.


